Showing posts with label structure. Show all posts

The fine-scale genetic structure of the French population

The fine-scale genetic structure of the French population (preprint):

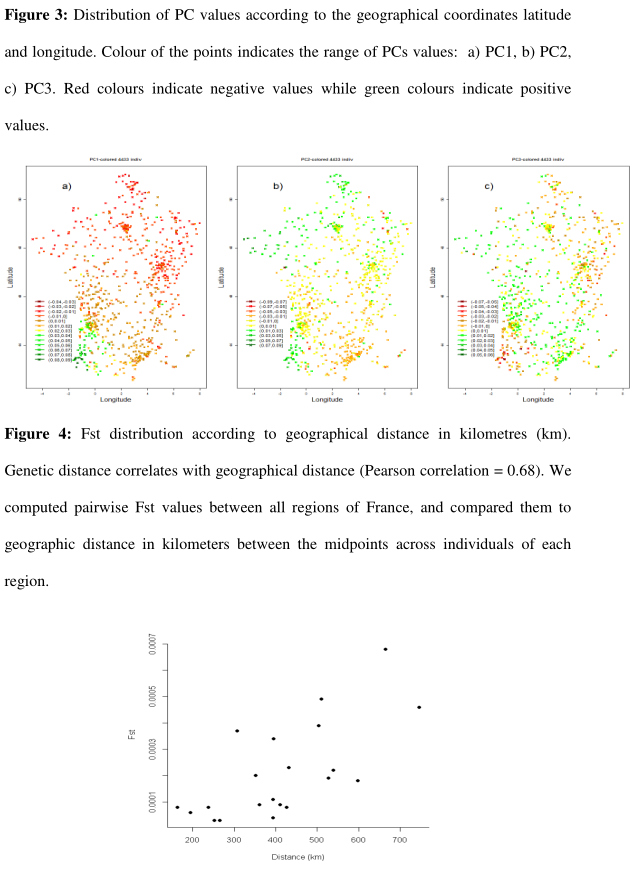
The existence of population stratification is a major problem in case-control association studies and there is a need for a better assessment of allele frequency variation within populations at all geographic scales. Such efforts have been conducted in different European countries where strong patterns of geographic variations were found. The genome-wide extent of variations in allele frequencies of common variants has however never been documented at the scale of France. In this study, we describe these patterns of variation using genome-wide SNP chip data from 4,433 individuals, recruited as part of the Three-City study and whose places of birth in France were available. We show that there is a strong correlation between the top three principal components extracted from the genetic data and the latitude and longitude of birth places. Using multiple linear regression models, we were able to determine the birth places within less than 197 km of the reported origin for 50% of the individuals. Using model-based clustering with seven main geographic regions, we found that individuals were assigned in majority to their true region of origin. However, we found that information on ancestry could not be retrieved by using a small panel of Ancestry-Informative Markers (AIMs).

India paper

The paper, Shared and Unique Components of Human Population Structure and Genome-Wide Signals of Positive Selection in South Asia, is free.
Summing up, our results confirm both ancestry and temporal complexity shaping the still on-going process of genetic structuring of South Asian populations. This intricacy cannot be readily explained by the putative recent influx of Indo-Aryans alone but suggests multiple gene flows to the South Asian gene pool, both from the west and east, over a much longer time span.
Dienekes: "I haven't read the paper fully yet (it's open access), but the abstract seems to agree with what I've written both here and over at the Dodecad blog, about South Asians being primarily a West Asian/South Asian variable mix." In fact, the authors note in the body of the paper:
Another example of an heuristic interpretation appears when we look at the two blue ancestry components (Figure 2B) that explain most of the genetic diversity observed in West Eurasian populations (at K = 8), we see that only the k4 dark blue component is present in India and northern Pakistani populations, whereas, in contrast, the k3 light blue component dominates in southern Pakistan and Iran. This patterning suggests additional complexity of gene flow between geographically adjacent populations because it would be difficult to explain the western ancestry component in Indian populations by simple and recent admixture from the Middle East.
Moreover:
Both PC2 and k5 light green at K = 8 extend from South Asia to Central Asia and the Caucasus (but not into eastern Europe). In an attempt to explore diversity gradients within this signal, we investigated the haplotypic diversity associated with the ancestry components revealed by ADMIXTURE. Our simulations show that one can detect differences in haplotype diversity for a migration event that occurred 500 generations ago, but chances to distinguish signals for older events will apparently decrease with increasing age because of recombination. In terms of human population history, our oldest simulated migration event occurred roughly 12,500 years ago and predates or coincides with the initial Neolithic expansion in the Near East. Knowing whether signals associated with the initial peopling of Eurasia fall within our detection limits requires additional extensive simulations, but our current results indicate that the often debated episode of South Asian prehistory, the putative Indo-Aryan migration 3,500 years ago (see e.g., Abdulla15) falls well within the limits of our haplotype-based approach. We found no regional diversity differences associated with k5 at K = 8. Thus, regardless of where this component was from (the Caucasus, Near East, Indus Valley, or Central Asia), its spread to other regions must have occurred well before our detection limits at 12,500 years. Accordingly, the introduction of k5 to South Asia cannot be explained by recent gene flow, such as the hypothetical Indo-Aryan migration.
First, note that the k5 "light green" ADMIXTURE component does in fact extend into and throughout Europe (apart from Sardinia). The authors believe they've shown "k5" must have "spread" well before the Neolithic. What they've actually demonstrated is that ADMIXTURE (at least as used here) will not be the tool to disentangle complex recent population movements in Eurasia.

Next PoBI paper should be more interesting

Another ICHG/ASHG 2011 abstract:
People of the British Isles: An analysis of fine-scale population structure in a UK control population. S. Leslie1, B. Winney1, G. Hellenthal2, S. Myers2, A. Boumertit1, T. Day1, K. Hutnik1, E. Royrvik1, D. Lawson3, D. Falush4, P. Donnelly2, W. Bodmer1 1) Department of Oncology, University of Oxford, Oxford, United Kingdom; 2) Wellcome Trust Centre for Human Genetics, University of Oxford, Oxford, United Kingdom; 3) Department of Mathematics, University of Bristol, Bristol, United Kingdom; 4) Max Planck Institute for Evolutionary Anthropology, Leipzig, Germany.

There is a great deal of interest in fine scale population structure in the UK, both as a signature of historical immigration events and because of the effect population structure may have on disease association studies. Although population structure appears to have a minor impact on the current generation of genome-wide association studies, it is likely to play a significant part in the next generation of studies designed to search for rare variants. A powerful means of detecting such structure is to control and document carefully the provenance of the samples involved. Here we describe the collection of a cohort of rural UK samples (The People of the British Isles), aimed at providing a well-characterised UK control population that can be used as a resource by the research community as well as providing fine scale genetic information on the British population. So far, some 4000 samples have been collected, the majority of which fit the criteria of coming from a rural area and having all four grandparents from approximately the same area. Three thousand samples were genotyped on the Illumina 1.2M and Affymetrix v6.0 platforms as part of WTCCC2. Using a novel clustering algorithm that takes into account linkage disequilibrium structure, approximately 3000 of the samples were clustered, using these comprehensive genotyping data, into more than 50 groups purely as a function of their genetic similarities without any reference to their know locations. When the appropriate geographical position of each individual within a cluster is plotted on a map of the UK, there is a striking association between clusters and geography, which reflects to a major extent the known history of the British peoples. Thus, for example, even individuals from Cornwall and Devon, the two adjacent counties in the southwestern tip of Britain, fall into different, but coherent clusters. Further details of this comprehensive analysis of the genetic structure of the People of the British Isles, together with a description of the provenance of the samples, will be give in the presentation. We believe that this is the first time that such a detailed fine scale genetic structure of a population of generally very similar individuals has been possible. This has been achieved through, on the one hand, a careful geographically structured collection of samples and, on the other hand, an approach to analysis that takes into account fully the linkage disequilibrium structure of the population.

Editorial and preliminary paper on People of the British Isles project

Both freely accessible.

A British approach to sampling:

The acronym ‘PoBI’ may not yet be familiar to human geneticists in the way that ‘HGDP’, ‘WTCCC’ or ‘HapMap’ are, but a paper in this issue of EJHG1 that introduces the ‘People of the British Isles’ project to the scientific community aims to change this. The PoBI project will collect up to 5000 DNA samples from diverse regions of the British Isles, taking great care to sample individuals with several generations of ancestry in rural locations. These samples are intended to serve as controls for future medical genetic studies, and to provide insights into the peopling of the British Isles over the last few millennia. [. . .] Although readers will have to wait for future publications to discover the insights from these large-scale genetic analyses, the current paper describes the sampling strategy and initial 3865 samples in some detail, outlines an approach to investigating fine-scale population structure using surnames, and presents some preliminary genetic analyses of a handful of chosen loci. [. . .]

In addition to collecting blood, the project recorded surnames. Using data from a census performed in 1881, these were classified as ‘local’ or ‘non-local’, and the two classes examined separately. The authors then modelled a population such as that from central England as a mixture between south-western (taken to represent Ancient Britons) and eastern (Anglo Saxon) populations, and estimated the contribution of each population to the central England autosomal genotypes. These contributions differed between the local surname class (mostly eastern) and the non-local class (half and half), which the authors take as evidence of subtle population structure. Published genetic analyses using much larger numbers of markers have already detected low, but significant levels of genetic structure within Britain in more straightforward ways,4, 5 even with less stringently ascertained samples (Figure 1): Europe-wide south-east to north-west gradients extend into the British Isles. We can look forward to deeper insights into genetic differentiation and its causes when large-scale genetic analyses of the PoBI samples are available.

[. . .] anthropological and evolutionary geneticists should rejoice in the assembly of this resource, the foresight of The Wellcome Trust in funding the project over a decade or so, and hope that resources are available for establishing more cell lines and performing more genome-wide sequencing, so that both the full set of samples and their sequences can be made widely available.

It is obvious why British people interested in their ancestry, and medical geneticists working with British subjects should welcome PoBI, but why should others pay attention? PoBI will not provide information about global genetic diversity in the way that HGDP7 and HapMap8 do, but its microcosmic survey of genetic variation in a set of small islands off the western coast of the Eurasian continent is revealing the level of differentiation that builds up over millennia via events well documented by archaeology and history, so these alternative data sets can be compared to address questions about the initial peopling of the area, and its subsequent reshaping by internal and external forces. And if the characteristics of the British – politeness, eccentricity, or drunken loutishness, according to your viewpoint and experience – have any genetic basis, perhaps PoBI can provide a starting point for identifying it! 

People of the British Isles: preliminary analysis of genotypes and surnames in a UK-control population:
There is a great deal of interest in a fine-scale population structure in the UK, both as a signature of historical immigration events and because of the effect population structure may have on disease association studies. Although population structure appears to have a minor impact on the current generation of genome-wide association studies, it is likely to have a significant part in the next generation of studies designed to search for rare variants. A powerful way of detecting such structure is to control and document carefully the provenance of the samples involved. In this study, we describe the collection of a cohort of rural UK samples (The People of the British Isles), aimed at providing a well-characterised UK-control population that can be used as a resource by the research community, as well as providing a fine-scale genetic information on the British population. So far, some 4000 samples have been collected, the majority of which fit the criteria of coming from a rural area and having all four grandparents from approximately the same area. Analysis of the first 3865 samples that have been geocoded indicates that 75% have a mean distance between grandparental places of birth of 37.3 km, and that about 70% of grandparental places of birth can be classed as rural. Preliminary genotyping of 1057 samples demonstrates the value of these samples for investigating a fine-scale population structure within the UK, and shows how this can be enhanced by the use of surnames.

Swedish population structure

Via Dienekes, The Genetic Structure of the Swedish Population:
An analysis of genetic differentiation (based on pairwise Fst) indicated that the population of Sweden's southernmost counties are genetically closer to the HapMap CEU samples of Northern European ancestry than to the populations of Sweden's northernmost counties. [. . .] We have shown that genetic differences within a single country may be substantial, even when viewed on a European scale.
The paper is in PLoS ONE (i.e., it's open access). More:

Sorbs autosomally distinct from Germans

Population-genetic comparison of the Sorbian isolate population in Germany with the German KORA population using genome-wide SNP arrays (abstract; provisional pdf):

Background

The Sorbs are an ethnic minority in Germany with putative genetic isolation, making the population interesting for disease mapping. A sample of N=977 Sorbs is currently analysed in several genome-wide meta-analyses. Since genetic differences between populations are a major confounding factor in genetic meta-analyses, we compare the Sorbs with the German outbred population of the KORA F3 study (N=1644) and other publically available European HapMap populations by population genetic means. We also aim to separate effects of over-sampling of families in the Sorbs sample from effects of genetic isolation and compare the power of genetic association studies between the samples.

Results

The degree of relatedness was significantly higher in the Sorbs. Principal components analysis revealed a west to east clustering of KORA individuals born in Germany, KORA individuals born in Poland or Czech Republic, Half-Sorbs (less than four Sorbian grandparents) and Full-Sorbs. The Sorbs cluster is nearest to the cluster of KORA individuals born in Poland. The number of rare SNPs is significantly higher in the Sorbs sample. FST between KORA and Sorbs is an order of magnitude higher than between different regions in Germany. Compared to the other populations, Sorbs show a higher proportion of individuals with runs of homozygosity between 2.5 Mb and 5 Mb. Linkage disequilibrium (LD) at longer range is also slightly increased but this has no effect on the power of association studies. Oversampling of families in the Sorbs sample causes detectable bias regarding higher FST values and higher LD but the effect is an order of magnitude smaller than the observed differences between KORA and Sorbs. Relatedness in the Sorbs also influenced the power of uncorrected association analyses.

Conclusions

Sorbs show signs of genetic isolation which cannot be explained by over-sampling of relatives, but the effects are moderate in size. The Slavonic origin of the Sorbs is still genetically detectable. Regarding LD structure, a clear advantage for genome-wide association studies cannot be deduced. The significant amount of cryptic relatedness in the Sorbs sample results in inflated variances of Beta-estimators which should be considered in genetic association analyses.

The computer program STRUCTURE does not reliably identify the main genetic clusters within species

Says this guy. While the author seems to be motivated by race-denialism, I think he's probably right that "forcing STRUCTURE to place individuals into too few clusters" can lead to non-optimal results (which would be consistent with what Dienekes appears to be finding). Certainly, contra Rienzi's railing against "incompetent amateurs, with their K=15 ADMIXTURE plots and clustering with up to 124 components", there's no reason to assume that in general runs with lower K will give more meaningful or accurate results than runs with higher K using programs like STRUCTURE and admixture.

I'm not terribly interested in Kalinowski's specific attempt to prove that African farmers are genetically closer to Europeans than to African hunter gatherers, but two things: (1) if this is true, I'd say it's much more likely to be attributable to back-migrations from Eurasia than to Europeans being descended from "African farmers"; (2) I enjoyed the section of the article in which the author promotes neighbor-joining trees as a superior method for visualizing relationships between populations, only to go on to explain that "even a tree with a R2 of 0.98 does not accurately depict all of the relationships between populations" since it still "depicts all sub-Saharan African populations as being more similar to each other than to European populations."

Reference: KALINOWSKI ST (2010) The computer program STRUCTURE does not reliably identify the main genetic clusters within species: simulations and implications for human population structure. Heredity (Published online). pdf

Conferences

PDF slides of some presentations from Family Tree DNA's "6th International Conference on Genetic Genealogy", which took place at the end of October: Family Finder: Looking Under the Hood; Family Finder & Population Finder; "Inferring Genetic Ancestry: Oppourtunities, Challenges, and Implications"; IT Roadmap 2010; Predicting Individual Ancestry Using Genome-wide Genetic Data; Summarizing and Anticipating the Next Decade with NRY, mtDNA, and Autosomal DNA; Walk Through the Y Project.

Michael Hammer (according to an attendee): "village of origin can and will be done in the future as the database grows".

The 60th Annual ASHG meeting was held November 2-6 in Washington, D.C. A 23andMe employee comments and links to other coverage (see end of post) here. Video and slides from a 1000 Genomes Project tutorial here.
According to Luke Jostins:
at Biology of Genomes conference in May of next year; we’ll be putting out a large (~1100) sample dataset from around a dozen populations. These will be based on low-coverage whole-genome and high-coverage exome data on every sample, along with >2M genotypes from the Omni2.5 chip, to create a very high-quality set of data. Lots of work is going into putting together combined SNP, indel and CNV calls as nicely phased haplotypes. This dataset should be a massive boon to association studies
This should also provide an additional public source of data for people undertaking projects like Polako's and Dienekes'.

Ancestry analysis method

Jombart T, Devillard S, Balloux F. Discriminant analysis of principal components: a new method for the analysis of genetically structured populations. BMC Genet. 2010 Oct 15;11(1):94.
BACKGROUND: The dramatic progress in sequencing technologies offers unprecedented prospects for deciphering the organization of natural populations in space and time. However, the size of the datasets generated also poses some daunting challenges. In particular, Bayesian clustering algorithms based on pre-defined population genetics models such as the STRUCTURE or BAPS software may not be able to cope with this unprecedented amount of data. Thus, there is a need for less computer-intensive approaches. Multivariate analyses seem particularly appealing as they are specifically devoted to extracting information from large datasets. Unfortunately, currently available multivariate methods still lack some essential features needed to study the genetic structure of natural populations.

RESULTS: We introduce the Discriminant Analysis of Principal Components (DAPC), a multivariate method designed to identify and describe clusters of genetically related individuals. When group priors are lacking, DAPC uses sequential K-means and model selection to infer genetic clusters. Our approach allows extracting rich information from genetic data, providing assignment of individuals to groups, a visual assessment of between-population differentiation, and contribution of individual alleles to population structuring. We evaluate the performance of our method using simulated data, which were also analyzed using STRUCTURE as a benchmark. Additionally, we illustrate the method by analyzing microsatellite polymorphism in worldwide human populations and hemagglutinin gene sequence variation in seasonal influenza.

CONCLUSIONS: Analysis of simulated data revealed that our approach performs generally better than STRUCTURE at characterizing population subdivision. The tools implemented in DAPC for the identification of clusters and graphical representation of between-group structures allow to unravel complex population structures. Our approach is also faster than Bayesian clustering algorithms by several orders of magnitude, and may be applicable to a wider range of datasets.
Website: http://adegenet.r-forge.r-project.org/

Demographic simulation framework

Ray N, Currat M, Foll M, Excoffier L. SPLATCHE2: a spatially-explicit simulation framework for complex demography, genetic admixture and recombination. Bioinformatics. 2010 Oct 17.
SUMMARY: SPLATCHE2 is a program to simulate the demography of populations and the resulting molecular diversity for a wide range of evolutionary scenarios. The spatially-explicit simulation framework can account for environmental heterogeneity and fluctuations, and it can manage multiple population sources. A coalescent-based approach is used to generate genetic markers mostly used in population genetics studies (DNA sequences, SNPs, STRs, or RFLPs). Various combinations of independent, fully or partially linked genetic markers can be produced under a recombination model based on the ancestral recombination graph. Competition between two populations (or species) can also be simulated with user-defined levels of admixture between the two populations. SPLATCHE2 may be used to generate the expected genetic diversity under complex demographic scenarios and can thus serve to test null hypotheses. For model parameter estimation, SPLATCHE2 can easily be integrated into an Approximate Bayesian Computation (ABC) framework. Availability and Implementation: SPLATCHE2 is a C++ program compiled for Windows and Linux platforms. It is freely available at www.splatche.com, together with its related documentation and example data. CONTACT: mathias.currat@unige.ch.

Population structure math: two recent papers

Analysis of Population Structure: A Unifying Framework and Novel Methods Based on Sparse Factor Analysis
Two different approaches have become widely used in the analysis of population structure: admixture-based models and principal components analysis (PCA). In admixture-based models each individual is assumed to have inherited some proportion of its ancestry from one of several distinct populations. PCA projects the individuals into a low-dimensional subspace. On the face of it, these methods seem to have little in common. Here we show how in fact both of these methods can be viewed within a single unifying framework. This viewpoint should help practitioners to better interpret and contrast the results from these methods in real data applications. It also provides a springboard to the development of novel approaches to this problem. We introduce one such novel approach, based on sparse factor analysis, which has elements in common with both admixture-based models and PCA. As we illustrate here, in some settings sparse factor analysis may provide more interpretable results than either admixture-based models or PCA.
Theoretical Formulation of Principal Components Analysis to Detect and Correct for Population Stratification
The Eigenstrat method, based on principal components analysis (PCA), is commonly used both to quantify population relationships in population genetics and to correct for population stratification in genome-wide association studies. However, it can be difficult to make appropriate inference about population relationships from the principal component (PC) scatter plot. Here, to better understand the working mechanism of the Eigenstrat method, we consider its theoretical or “population” formulation. The eigen-equation for samples from an arbitrary number () of populations is reduced to that of a matrix of dimension , the elements of which are determined by the variance-covariance matrix for the random vector of the allele frequencies. Solving the reduced eigen-equation is numerically trivial and yields eigenvectors that are the axes of variation required for differentiating the populations. Using the reduced eigen-equation, we investigate the within-population fluctuations around the axes of variation on the PC scatter plot for simulated datasets. Specifically, we show that there exists an asymptotically stable pattern of the PC plot for large sample size. Our results provide theoretical guidance for interpreting the pattern of PC plot in terms of population relationships. For applications in genetic association tests, we demonstrate that, as a method of correcting for population stratification, regressing out the theoretical PCs corresponding to the axes of variation is equivalent to simply removing the population mean of allele counts and works as well as or better than the Eigenstrat method.

Assortative mating by ancestry among American whites

Testing for non-random mating: evidence for ancestry-related assortative mating in the Framingham heart study.
Population stratification leads to a predictable phenomenon-a reduction in the number of heterozygotes compared to that calculated assuming Hardy-Weinberg Equilibrium (HWE). We show that population stratification results in another phenomenon-an excess in the proportion of spouse-pairs with the same genotypes at all ancestrally informative markers, resulting in ancestrally related positive assortative mating. We use principal components analysis to show that there is evidence of population stratification within the Framingham Heart Study, and show that the first principal component correlates with a North-South European cline. We then show that the first principal component is highly correlated between spouses (r = 0.58, p = 0.0013), demonstrating that there is ancestrally related positive assortative mating among the Framingham Caucasian population. We also show that the single nucleotide polymorphisms loading most heavily on the first principal component show an excess of homozygotes within the spouses, consistent with similar ancestry-related assortative mating in the previous generation. This nonrandom mating likely affects genetic structure seen more generally in the North American population of European descent today, and decreases the rate of decay of linkage disequilibrium for ancestrally informative markers. Genet. Epidemiol. 2010.

Another intra-European AIMs paper

Drineas P, Lewis J, Paschou P (2010) Inferring Geographic Coordinates of Origin for Europeans Using Small Panels of Ancestry Informative Markers. PLoS ONE 5(8): e11892.
Analyzing 1,200 individuals from 11 populations genotyped for more than 500,000 SNPs (Population Reference Sample), we present a systematic exploration of the extent to which geographic coordinates of origin within Europe can be predicted, with small panels of SNPs. Markers are selected to correlate with the top principal components of the dataset, as we have previously demonstrated. Performing thorough cross-validation experiments we show that it is indeed possible to predict individual ancestry within Europe down to a few hundred kilometers from actual individual origin, using information from carefully selected panels of 500 or 1,000 SNPs. Furthermore, we show that these panels can be used to correctly assign the HapMap Phase 3 European populations to their geographic origin. [. . .] It is also worth noting that the largest average error was in the German samples and that the most accurately predicted populations were the Southern European and Irish ones. [. . .] Interestingly, within Europe, individual origin seems much easier to predict along the North to South axis than along the East to West axis. This could indicate increased gene flow along the latter axis.
Estimated coordinates for the CEU sample (Utah whites):

NordicDB: a Nordic pool and portal for genome-wide control data

An abstract from European Journal of Human Genetics:
A cost-efficient way to increase power in a genetic association study is to pool controls from different sources. The genotyping effort can then be directed to large case series. The Nordic Control database, NordicDB, has been set up as a unique resource in the Nordic area and the data are available for authorized users through the web portal (http://www.nordicdb.org). The current version of NordicDB pools together high-density genome-wide SNP information from ~5000 controls originating from Finnish, Swedish and Danish studies and shows country-specific allele frequencies for SNP markers. The genetic homogeneity of the samples was investigated using multidimensional scaling (MDS) analysis and pairwise allele frequency differences between the studies. The plot of the first two MDS components showed excellent resemblance to the geographical placement of the samples, with a clear NW–SE gradient. We advise researchers to assess the impact of population structure when incorporating NordicDB controls in association studies. This harmonized Nordic database presents a unique genome-wide resource for future genetic association studies in the Nordic countries.
The first thing that stands out to me in the MDS plot from the NordicDB website is the substantial overlap between the Danish sample and the CEU HapMap sample (Utah whites):
Top axes of genetic variation in the Nordic Control Database (4620 samples) contrasted with the CEU population (108 samples) HapMap and a Finnish reference population (81 samples). The MDS analysis was performed on approximately 45K SNPs that were common between the genotyping platforms. The samples are represented with the color of their country of origin: Finland (red), Sweden (green) and Denmark (yellow).

Very fine-scale population structure in Europe

Genes predict village of origin in rural Europe:
Using genome-wide scans and individuals with all four grandparents born in the same settlement, we here demonstrate remarkable geographical structure across 8–30 km in three different parts of rural Europe. After excluding close kin and inbreeding, village of origin could still be predicted correctly on the basis of genetic data for 89–100% of individuals. [. . .]

Such fine-scale differentiation is consistent with the highly nonrandom nature of human mate choice over the millennia. The average distance between the birthplaces of spouses in rural parts of Finland, the Po valley in northern Italy and the isles of Scotland in the nineteenth century was B1.5–3 km.10 Such close endogamy was probably the norm in rural Europe due to lack of transport or economic opportunities. The breakdown of these isolates has since dramatically altered the population structure.11

The exquisite structure preserved in the genomes of people with all grandparents from the same settlement demonstrates that very detailed genetic and geographical ancestry information can be obtained by genome-wide SNP analyses. This provides novel opportunities, under certain circumstances, to predict the micro-geographical origin of an individual. Genetic association studies that include rural populations must also model this genetic structure, but it is not a barrier to gene discovery.12 When whole-genome sequences become widely available, the ability to use many more variants, including rarer ones, to identify short shared genomic segments will perhaps allow routine identification of regional ancestries, given a suitably large and carefully collected reference sample.

New world African and Hispanic admixture studies

"Characterizing the admixed African ancestry of African Americans" finds American blacks:
are admixed in their African components of ancestry, with the majority contributions being from West and West-Central Africa, and only modest variation in these African-ancestry proportions among individuals. Furthermore, by principal components analysis, we found little evidence of genetic structure within the African component of ancestry in African Americans.
A study to be published at PNAS reconfirms a number of unsurprising findings about Hispanics. A more detailed breakdown of the Caucasoid componenet sounds like the most interesting aspect:
European migrant contributors were mostly from the Iberian Peninsula and Southern Europe. Evidence was also found for Middle Eastern and North African ancestry, reflecting the Moorish and Jewish (as well as European) origins of the Iberian populations at the time of colonization of the New World. The Native Americans that most influenced the Hispanic/Latino populations were primarily from local indigenous populations.
Update: "Genome-wide patterns of population structure and admixture among Hispanic/Latino populations" is now online.

Another method for inferring population structure

Assessing population genetic structure via the maximisation of genetic distance:
This new method used to infer the hidden structure in a population, based on the maximisation of the genetic distance and not taking into consideration any assumption about Hardy-Weinberg and linkage equilibrium, performs well under different simulated scenarios and with real data. Therefore, it could be a useful tool to determine genetically homogeneous groups, especially in those situations where the number of clusters is high, with complex population structure and where Hardy-Weinberg and/or linkage equilibrium are present.

SMGF adding genome-wide SNP data?

Something new I got out of Scott Woodward's Sorenson Molecular Genealogy Foundation presentation (slides) at the DTC Genetic Testing Workshop is that SMGF has Affymetrix 6.0 data for 300 samples. SMGF is best known for their Y-STR database, but the original aim was to connect autosomal markers and pedigree data. I didn't see how they could do much in this direction with the handful of autosomal STRs they were typing, but if they end up typing a large proportion of their 108,000 samples for ~1 million SNPs, I could see interesting things happening.

"European Americans" are not homogenous

A new paper in PLoS ONE, Genetic Population Structure Analysis in New Hampshire Reveals Eastern European Ancestry, tells us little that wasn't already obvious: genetic distinctions can be drawn among "white" Americans. Unfortunately, only 960 SNPs, mostly on "suspected cancer susceptibility genes", are used for the structure analysis, and most of the clusters reported (for example, Jewish-French Canadian-Candian Indian) don't seem terribly meaningful. "Eastern European ancestry" is mentioned in the title only because "Finnish and Russian/Polish/Lithuanian ancestries were most notably found to be associated with genetic substructure" in this data set. As we've seen repeatedly, with more markers, clear and meaningful genetic substructure is apparent throughout Europe and across various European ancestry groups in the US.